Plotting spectra with Sparky
From NMR Wiki
Sparky allows plotting 2D planes of NMR spectra to precise dimensions in the PostScript output format.
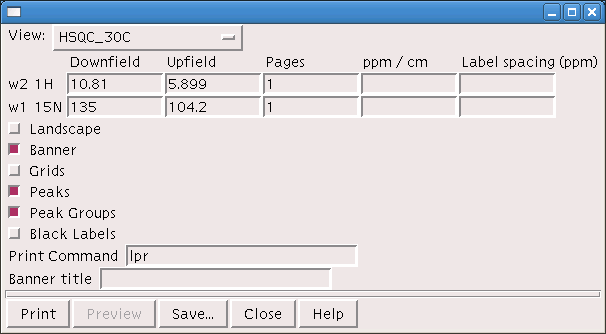
Plotting tool command it pt. Once typed, a dialog (shown below) will open.
Obtaining quick plots
- click into spectrum you want to print
- type pt
- click 'Save...' button and save postscript file
- 'Print' button may not work - depending on how your printer is set up
Creating a plot with set dimensions
Often it is important to prepare an image of a particular size, and spectral window.
- select data limits to print (Downfield and Upfield ppm values in the plane dimensions)
- calculate spectral width of each dimensions (SW=Downfield-Upfield)
- decide what is the desired display size in that dimension (SZ)
- calculate ppm/cm value as SW/SZ and type it into the corresponding ppm/cm cell
- write down this number for your future reverence (see note below)
- click 'Save...' button (print button may not work if printer is not configured for sparky)
Notes
- remember to turn off 1D traces if they are activated and if you don't want them to appear in your plot.
- write down ppm/cm value if used as sparky might forget it
- by default sparky saves files into <sparky_data_dir>/Lists directory - you may want to
Remember to append .ps to file names as sparky may not automatically do that and on some systems file extensions are important.


