Viewing 1D traces from 2D planes with Sparky
From NMR Wiki
Turning traces on
1D traces are views of a spectrum obtained from multi-dimensional data along some straight line in the data matrix.
Usually this line is selected along one of the dimensions of the spectrum.
Sparky allows viewing those traces if user types vS command (view slices).
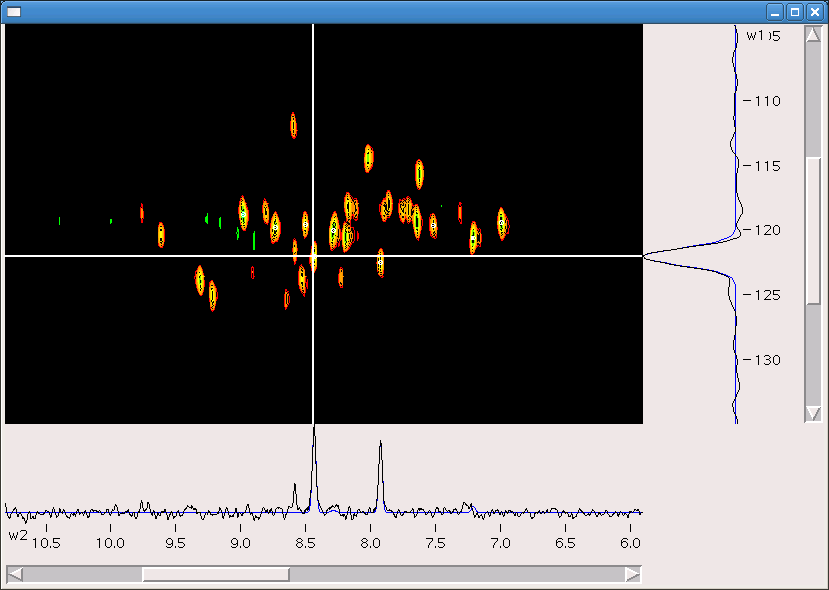
Once the command is typed, two panels will be added on the bottom (for the X-trace) and right side (for the Y-trace) of spectrum window.
The data traces will be extracted along the cursor lines (see figure below). (To obtain Z-trace one will have to rotate the spectrum view so that Z dimension is shown along one of the cursor lines)
Using traces to check quality of data fitting
vS mode can be used to check quality of data fitting.
Note that there are more traces in the figure then you might expect. In each panel there is a noisy black spectrum - which is the actual data trace and a much smoother blue line. Traces shown in color other then black are those obtained from fitted peak intensities (obtained by pi - peak integrate - tool).
Removing traces
To remove 1D traces type vS again.
Note that traces will be printed with the pt tool - if this is not what you want - turn traces off and then prepare the image file for printing.


