Analysis of HETLOC data
From NMR Wiki
First, list couplings that need to be collected (chances are all observable couplings won't be needed).
HETLOC experiment has a limitation that it won't show couplings to carbon atoms (or other X-nuclei to which HETLOC experiment might be tuned) if they are not connected to a proton.
Then, open HETLOC spectrum, and for a given coupling between atoms Cx and Hy:
- draw a horizontal line at ω1 (usually vertical dimension) = δ(Hx) - i.e. chemical shift of Cx-attached proton.
- draw a vertical line at ω2 = δ(Hy)
- note the point of intersection of the two lines
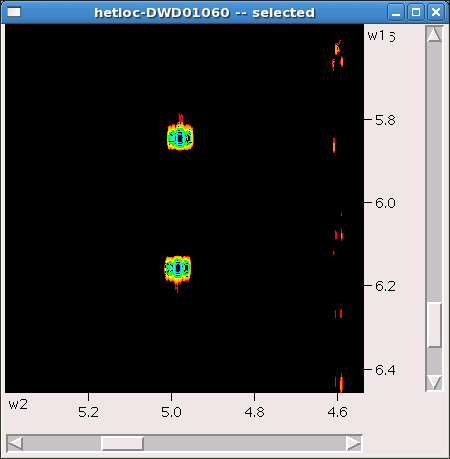
- somewhere symmetric to that point along the vertical line there might be two peaks or groups of peaks (i.e. if they are observable)
- two (groups of) peaks will be offset in ω1 by 1JCxHx
Read frequencies of the two peaks as described here and substract position of one peak in Hz along w2 axis from position of another.


